
Shining Cities 2017
How Smart Local Policies are Expanding Solar Power in America
Solar power grew at a record-breaking pace in 2016. The United States now has 42 gigawatts (GW) of solar photovoltaic (PV) energy capacity, enough to power 8.3 million homes and reduce carbon dioxide emissions by 52.3 million metric tons annually.1 Hundreds of thousands of Americans, especially in our cities, have invested in their own solar panels or solar projects in their communities and millions more are ready to join them.
Downloads
Solar power grew at a record-breaking pace in 2016. The United States now has 42 gigawatts (GW) of solar photovoltaic (PV) energy capacity, enough to power 8.3 million homes and reduce carbon dioxide emissions by 52.3 million metric tons annually.1 Hundreds of thousands of Americans, especially in our cities, have invested in their own solar panels or solar projects in their communities and millions more are ready to join them.
America’s major cities have played a key role in the clean energy revolution and stand to reap tremendous benefits from solar energy. As population centers, they are major sources of electricity demand and, with millions of rooftops suitable for solar panels, they have the potential to be major sources of clean energy as well.
As of the end of 2016, 20 cities—representing just 0.1 percent of U.S. land area—accounted for 5 percent of U.S. solar PV capacity. These 20 cities have nearly 2 GW of solar PV capacity—nearly as much solar power as the entire country had installed at the end of 2010.2
Figure ES-1: U.S. Cities by Cumulative Installed Solar PV Capacity, End of 2016
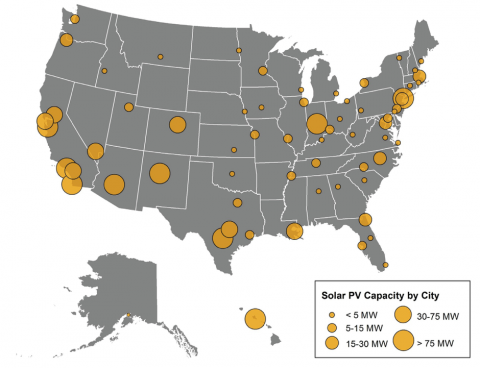
Table ES-1: Top 20 Solar Cities by Total Installed Solar PV Capacity, End of 2016*
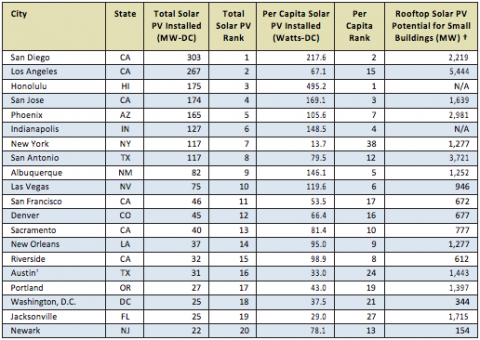
* This includes all solar PV capacity (rooftop and utility-scale solar installations) within the city limits of each city. It does not include solar power installed in the extraterritorial jurisdictions of cities, even those installed by or under contract to municipal utilities. See methodology for an explanation of how these rankings were calculated. See Appendix B for city-specific sources of data.
† This reflects the maximum technical solar PV capacity that could be installed on appropriate small building rooftops in each city. These figures were calculated by the U.S. Department of Energy. Data were unavailable for cities with “N/A” listed.4‡ Due to an improvement in methodology or data source for this city, total and per capita solar PV capacities reported in this table are not directly comparable with estimates for this city in previous versions of this report. See Appendix B for details on specific citiesSan Diego leads the nation in total installed solar PV capacity among the 66 cities surveyed in this report, replacing Los Angeles, which had been the national leader for the past three years. Honolulu rose from sixth place for total PV capacity at the end of 2015 to third place at the end of 2016. (See Table ES-1.)
Even the cities that have seen the greatest solar success still have vast amounts of untapped solar energy potential. For instance, San Diego has developed less than 14 percent of its technical potential for solar energy on small buildings.3
To take advantage of that potential, and move America toward an economy powered by 100 percent renewable energy, city, state and federal governments should adopt a series of pro-solar policies.
The cities with the most solar PV installed per capita are the “Solar Stars”—cities with 50 or more watts of installed solar PV capacity per person. These cities have experienced dramatic growth in solar energy and are setting the pace nationally for solar energy develop- ment. Honolulu, San Diego, San Jose, Indianapolis and Albuquerque are the top five cities in the nation for installed solar PV capacity per person. (See Figure ES-2 and Table ES-2.) Notable changes in 2016 include:
- Albuquerque rose to be among the top five cities for per capita solar PV capacity from being ranked 16th in 2013.
- Riverside, California rose to 8th place in 2016 from 20th in 2014.
- Between 2015 and 2016, San Francisco joined the ranks of the Solar Stars.
- In 2014, only eight of the surveyed cities had enough solar PV capacity per person to be ranked
“Solar Stars,” but at the end of 2016, 17 cities had solar capacity exceeding 50 watts per person.
Regional leaders for per capita solar capacity include Honolulu in the Pacific region, Albuquerque in the Mountain region, Indianapolis in the North Central region, New Orleans in the South Central region, Wilmington, Delaware, in the South Atlantic region and Burlington, Vermont, in the Northeast region.
America’s leading solar cities are those that have adopted strong pro-solar public policies or that are located within states that have done so. Among the most important steps cities have taken to advance solar energy are:
- Leading by example: The city government of Las Vegas now receives 100 percent of its energy needs from renewable sources, including a total of 6.2 MW of solar electric capacity. Solar energy systems are installed on 40 public buildings, including community centers, fire stations and parks. A 3.3 MW solar plant also provides power for the city’s wastewater treat- ment plant.5 Tampa and Raleigh have also installed large PV systems on city facilities and Albuquerque set a goal in 2016 to power its buildings with 25 percent solar energy by 2025.6 Cities that invest in solar power on public buildings not only save money on electricity, but they also demonstrate the value of solar energy to their residents.
- Expanding access through community solar policies and programs: Baltimore is making solar energy accessible to low-income households, nonprofits and small businesses through new loan and financing programs.7 Groups of homeowners and businesses in Athens, Georgia, and other cities have organized bulk purchasing programs that drive down the cost for everyone involved.8 New York and other cities are opening the solar energy market to apartment dwellers and others unable to install solar panels on their own roofs through Power Purchase Agreements (PPAs) that allow residents to purchase shares of solar power from other electric utility accounts.
- Making it easier and cheaper to switch to solar energy: In 2016, Kansas City, Missouri, and 21 other cities were recognized by the SolSmart Program for lowering the costs and time involved in switching to solar energy.9 Kansas City earned the acknowl- edgment for allowing consumers to complete their solar energy permitting process entirely online and for making its building code more friendly to solar energy installations.10 Non-hardware costs, like zoning and permitting, now make up about two-thirds of the total price of residential solar systems, so changes like these will significantly lower the barriers for consumers to switch to solar energy.11
- Adopting local policies that make solar energy the default: In 2016, San Francisco became the first major U.S. city to require that solar energy systems be installed during the construction of new buildings.12 It is much easier and cheaper to install systems when the structure is designed for their inclusion and when there is already equip- ment on-site.13 The state of California is now considering adopting a similar proposal.14
Figure ES-2: U.S. Cities by Installed Solar PV Capacity per Capita, End of 2016 (Watts Per Person)
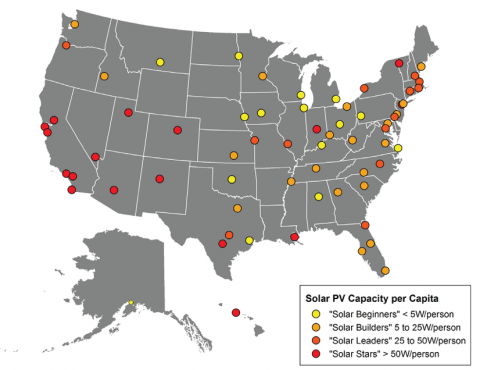
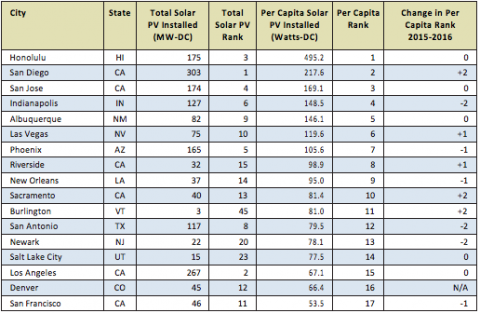
Table ES-2: The “Solar Stars” (Cities with 50 or More Watts of Solar PV per Person, End of 2016)
Cities with strong policies to compensate consumers for the solar energy they supply to the grid— such as net metering—are often leaders in solar development. Like rollover minutes on a cell phone bill, net metering gives renewable energy customers fair credit on their utility bills for the excess clean power they deliver to the grid. This simple billing arrangement is one of the most important policies for clearing the way for customer investment in solar.
Because net metering is such a powerful incentive for customers to switch to solar energy, fossil fuel interests and utilities have been attacking these policies across the country. In 2016 alone, 28 states proposed or passed changes to their net metering rules.15 For cities in these states, the changes have the potential to threaten their standing as solar energy leaders. For example, the controversial December 2015 decision by the Nevada Public Utility Commission to weaken net metering may threaten Las Vegas’ position as a top solar energy leader in the future.16
U.S. cities have only begun to tap their solar energy potential. Cities such as Los Angeles, New York, Chicago and San Antonio have the technical potential to generate tens to hundreds of times more solar energy than they currently do, according to a National Renew- able Energy Laboratory (NREL) analysis of technical rooftop solar potential on small buildings.17 In fact, the majority of the cities in this report have developed less than 2 percent of their technical solar PV potential and the city that has tapped the greatest share of its potential, Newark, developed less than 15 percent of it. By maintaining strong pro-solar public policies, these and other cities can continue to lead America toward a future of 100 percent clean, renewable energy.
Strong public policies at every level of govern- ment can help the United States continue to harness clean solar energy. To achieve the nation’s full solar potential:
- Local governments should follow the lead of top solar cities by setting strong goals for solar energy adoption, implementing programs and policies that promote the rapid expansion of solar energy, expanding access to all residents, installing solar energy systems on government buildings, and urging state and federal officials and investor-owned utilities to facilitate the growth of solar energy.
- State governments should set ambitious goals for solar energy adoption and adopt policies to meet them. It is critical that states have strong policies, such as net metering, to fairly compen- sate owners of solar energy systems for the energy they supply to the grid. States can also enact strong renewable electricity standards with solar carve-outs, community solar legisla- tion, tax credits for solar energy, and public benefits charges on electricity bills to raise funds for solar energy programs, as well as promote solar programs for low-income households. State governments should use their role as the primary regulators of electric utilities to encourage utility investments in solar energy and implement rate structures that maximize the benefits of solar energy to consumers.
- The federal government should maintain federal tax credits for solar energy and add provisions to enable nonprofit organizations, housing authori- ties and others who are not eligible for tax credits to benefit from those incentives. Federal officials should also increase investments for research, development and deployment programs designed to reduce the cost of solar energy and to speed the deployment of renewable energy, energy storage and smart grid technologies. These actions will be critical for the federal government to fulfill the commitments made in the Clean Power Plan and Paris Climate Agreement.
Notes
1. Solar Energy Industries Association (SEIA), U.S. Solar Market Insight: Solar Adds 14.8 Gigawatts of Capacity in Record 2016, On Track to Triple in Size by 2022, 9 March 2017, archived at web.archive.org/web/20170327184540/http:// www.seia.org/research-resources/us-solar-market-insight.
2. Land area was calculated using the city land areas provided by the United States Census Bureau’s City Quick- facts. They define land area as the size of all areas desig- nated as land in the Census Bureau’s national geographic database. United States Census Bureau, Land Area and Persons per Square Mile, accessed at quickfacts.census.gov/ qfd/meta/long_LND110210.htm, 3 March 2015.
3. U.S. Department of Energy, Energy Efficiency & Renewable Energy – State & Local Energy Data, available at apps1.eere.energy.gov/sled/#.
4. Ibid.
5. Marco N. Velotta, MS, AICP, LEED Green Assoc., Of- fice of Sustainability, Planning Department – Long Range Planning, City of Las Vegas, personal communication, 24 January 2017.
6. Environment New Mexico, Albuquerque City Coun- cil Unanimously Embraces Solar Future (press release), 20 September 2016.
7. Anna Hofmann, Environment Maryland, As Balti- more Develops a Low-Income Solar Program, Residents Could See More Benefits From The Sun (press release), October 2016.
8. Solar CrowdSource, Solarize Athens, archived at web. archive.org/web/20170222165509/http://www.solarcrowd- source.com/projects/solarize-athens.
9. The Solar Foundation, “Fourteen Communities Designated “SolSmart Gold” for Encouraging Solar Market Growth,” September 2016.